The Easiest Way to Track Data Science Experiments with MLRun
Adi Hirschtein | June 10, 2022
As a very hands-on VP of Product, I have many, many conversations with enterprise data science teams who are in the process of developing their MLOps practice. Almost every customer I meet is in some stage of developing an ML-based application. Some are just at the beginning of their journey while others are already heavily invested. It’s fascinating to see how data science, a once commonly used buzz word, is becoming a real and practical strategy for almost any company.
In the following post, I’ll address one of challenges that customers bring up time and again: running and tuning data science experiments. With a step by step tutorial I’ll cover complexity concerns and show how to solve them with MLRun, our open source MLOps orchestration framework which enables a simple, continuous, and automated way of creating scalable production pipelines.
MLRun is all about automation: with a few simple lines of code, it automates the build process, execution, data movement, scaling, versioning, parameterization, outputs tracking, CICD integration, deployment to production, monitoring, and more. MLRun enables data science teams to track machine learning experiments by providing a generic and easy to use mechanism to describe and track code, metadata, inputs and outputs of machine learning related tasks (executions).
Machine learning experiment management is part of any healthy MLOps process. MLRun tracks various elements, stores them in a database and presents all running jobs as well as historical jobs in a single report.
The database location is configurable and users run queries to search for specific jobs based on criteria. Users work on MLRun on a local IDE or notebook and then run the same code on a larger cluster using scale-out containers or functions.
Install MLRun
Install the MLRun library, run import commands and set the path for the MLRun database:
		!pip install git+https://github.com/mlrun/mlrun.git
from mlrun import new_function, RunTemplate, NewTask, get_run_db
import yaml
import pandas as pd
# set mlrun db path (can also be specified in run_start command)
%env MLRUN_META_DBPATH=./
Key elements
- Task (run) – enables you to define the desired parameters, inputs, outputs and tracking of a run. A run can be created from a template and run over different runtimes or functions.
- Function - a runtime specific software package and attributes (e.g. image, command, args, environment, etc.). A function can run one or many runs/tasks and can be created from templates.
- Runtime - a computation framework. MLRun supports multiple runtimes such as a local Kubernetes job, DASK, Nuclio, Spark and mpijob (Horovod). Runtimes may support parallelism and clustering (i.e. distributing the work among processes/containers).
Add MLRun hooks to the code
To capture the data mentioned above, add hooks in the job itself. You can track the results of the job, artifacts such as the model file or csv file, source code, labels and more.
MLRun introduces the concept of an ML context. Code is instrumented to get parameters and inputs from the context as well as log outputs, artifacts, tags and time-series metrics.
		from mlrun.artifacts import ChartArtifact, TableArtifact, PlotArtifact
import matplotlib.pyplot as plt
import numpy as np
import pandas as pd
# define a function with spec as parameter
import time
def handler(context, p1=1, p2='xx'):
# access input metadata, values, and inputs
    print(f'Run: {context.name} (uid={context.uid})')
    print(f'Params: p1={p1}, p2={p2}')
    time.sleep(1)

# log the run results (scalar values)
    context.log_result('accuracy', p1 * 2)
    context.log_result('loss', p1 * 3)

    # add a lable/tag to this run
    context.set_label('category', 'tests')

    # log a simple artifact + label the artifact
    context.log_artifact('model.txt', body=b'abc is 123', labels={'framework': 'xgboost'})

    # create a matplot figure and store as artifact
    fig, ax = plt.subplots()
    np.random.seed(0)
    x, y = np.random.normal(size=(2, 200))
    color, size = np.random.random((2, 200))
    ax.scatter(x, y, c=color, s=500 * size, alpha=0.3)
    ax.grid(color='lightgray', alpha=0.7)
    context.log_artifact(PlotArtifact('myfig', body=fig))

    # create a dataframe artifact
    df = pd.DataFrame([{'A':10, 'B':100}, {'A':11,'B':110}, {'A':12,'B':120}])
    context.log_artifact(TableArtifact('mydf.csv', df=df, visible=True))

    return 'my resp'
Running the job
Specifically for this example, we are using an inline code withing Jupyter. but note that you can also save and run it as a python file.
Next, define the task and its parameters, such as task name, input parameters, secret file (if needed) and labels.
Create a function, specify the command (i.e. our Python script) and assign it to the task that was defined previously.
Once the job is done it will display the information that had been captured in the MLRun tracking database while the job was running.
		task = NewTask(handler=handler,name='demo', params={'p1': 5}).set_label('type', 'demo')
run = new_function().run(task)
The job is captured in the MLRun database.
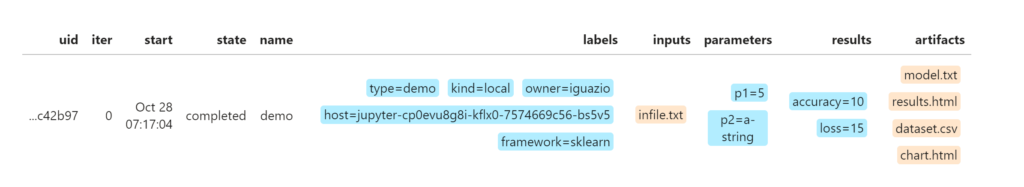
For each run you can view the name, status, labels and all parameters and artifacts that are associated with the run.
View the database at any point by using the following commands:
		db_path = %env MLRUN_META_DBPATH
db = get_run_db(db_path).connect()
db.list_runs(labels='demo').show()
Running jobs with hyper parameters
Hyper parameters are important because they directly control the behavior of the training algorithm and have a significant impact on the performance of the model being trained. Data scientists often want to run the same model with different parameters to figure out which configuration is the best fit.
First, create a template (see below) and then run it with the hyper_params flag.
In this case, MLRun tracks the information for each individual running instance, making it easy to compare between the different runs.
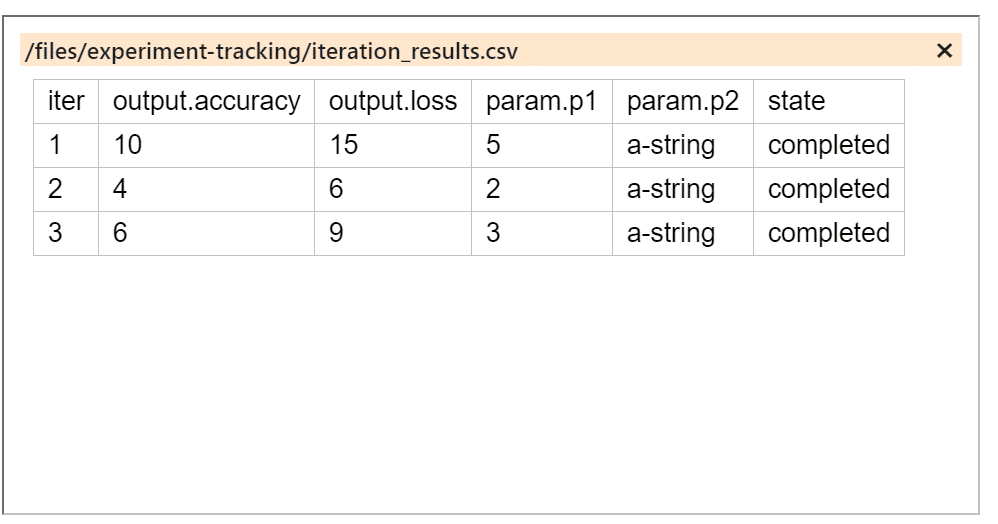
Based on the example below, run three iterations of the training job, each with a different parameter and see how the job identifies the iteration with the lowest loss.
		task = NewTask(handler=handler).with_hyper_params({'p1': [5, 2, 3]}, 'min.loss')
run = new_function().run(task)
View job results
Once the job is done the results are displayed. Click on the ’iteration_results’ artifact to open a window with detailed information. In our case, iteration number two has the lowest loss score, which is defined as our best fit function, and therefore is displayed as the ’best_iteration’.

Showing the iteration_results
To conclude
Running and tracking data science jobs may require lots of DevOps and labor-intensive tasks if you’re trying to do everything on your own. MLRun provides the flexibility to run any job either locally on your laptop or on a distributed cluster at scale in a much simpler way. Users easily run reports to get details on each and every job and If needed, any previous job can be reproduced and run again with all its artifacts and meta data.
For more details on MLRun go to the MLRun repo https://github.com/mlrun/mlrun
Next steps
Running on the Iguazio MLOps Platform provides the ability to pick and choose various built-in frameworks and run jobs at scale, accelerating performance and eliminating infrastructure overhead throughout the entire machine learning pipeline.
MLRun includes many more features, more than we can cover in just one blog.
To get up and running with MLRun, check out our Quick Start.
MLRun is an integral part of the Iguazio platform. Iguazio is an enterprise-ready MLOps platform that includes MLRun, along with many other managed services.

