Machine Learning Experiment Tracking from Zero to Hero in 2 Lines of Code
Xingsheng Qian | June 21, 2022
Why Experiment Tracking
In your machine learning projects, have you ever wondered “why is model Y is performing better than Z, which dataset was model Y trained on, what are the training parameters I used for model Y, and what are the model performance metrics I used to select model Y?” Does this sound familiar to you? Have you wondered if there is a simple way to answer the questions above? Data science experiments can get complex, which is why you need a system to simplify tracking.
In this blog, you will learn how you can perform all those tasks (as well as set up an automated machine learning pipeline) with a few simple steps using MLRun.
Automated Experiment Tracking with MLRun
MLRun is an open source framework to orchestrate MLOps from the research stage to production-ready AI applications. With a feature store and a modular strategy, MLRun enables a simple, continuous, and automated way of creating scalable production pipelines. MLRun automates the build process, execution, data movement, scaling, versioning, parameterization, outputs tracking, CI/CD integration, deployment to production, monitoring, and more.
MLRun empowers multiple-functional ML teams to collaborate on the orchestration of the entire ML lifecycle and automate MLOps. MLRun simplifies and accelerates the time to production.
To learn more about the MLRun open source project, please refer to this git repo.
In this article, you will see how to turn your existing model training code into an MLRun job and get the benefit of all the experiment tracking, plus more.
Setting up the MLRun Environment
MLRun can be configured to run on Docker or Kubernetes. With the Kubernetes in Docker Desktop, it gives you the fastest path to run MLRun in Kubernetes. To run the example in this article, we are going to work with MLRun using Kubernetes. To set up MLRun in Kubernetes on your desktop, you can follow the installation instruction in this GitHub repo here.
The output from your installation looks like this:
MLRun UI: http://localhost:30060
Jupyter Notebook: http://localhost:30040
Nuclio UI: http://localhost:30050
MLRun API: http://localhost:30070
Now you have an MLRun environment on your desktop you can run all kinds of MLRun jobs.
Your Development Environment
You can use the IDE of your choice to write your code. The MLRun documentation includes details on setting a Remote Environment using PyCharm, VSCode, or other IDEs. For this exercise, we will use the Jupyter notebook service deployed with MLRun. The notebook runs on http://localhost:30040.
Train Model with Experiment Tracking in MLRun
The scenario: you have an existing model training code in your favorite Jupyter Notebook. Here are the steps:
- Train your model using the original notebook.
- Add two lines of code to your original notebook.
- Run the training job in MLRun. This will give you all the experiment tracking.
Clone the example notebooks from GitHub
In this example, we will use the CIFAR10 data set to train a Convolutional Neural Network (CNN) model for image classification
git clone https://github.com/xsqian/experiment-tracking
In the Jupyter Notebook, you can run the original training job:
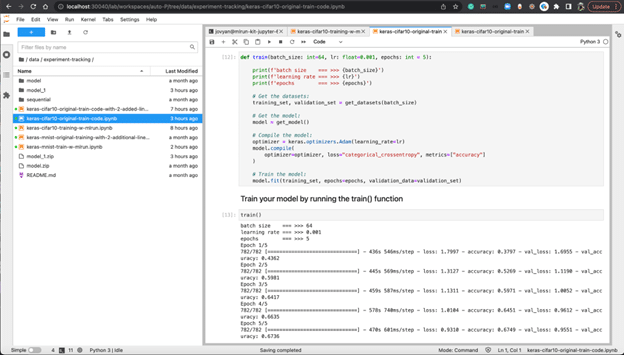
It is not the most interesting thing to run your original training code in a Jupyter Notebook here. The interesting part is that when we add two lines of code to the train() function of the original notebook.
context = mlrun.get_or_create_ctx(name="cifar10_ctx")
mlrun_tf_keras.apply_mlrun(model=model, context=context)
Then run the training code within an MLRun job, and we will immediately get all the experiments tracked by the magic of those two lines. Behind the scenes, those two lines of code in the MLRun platform do all the heavy lifting for you so you can focus on your machine learning model experimentation. It seamlessly provides automatic logging (for both MLRun and Tensorboard) and doesn’t matter what training frameworks you use, whether it’s TensorFlow or PyTorch.
Here, once you run the training with the following parameters:
batch_size: 65
lr: 0.001
epochs: 5
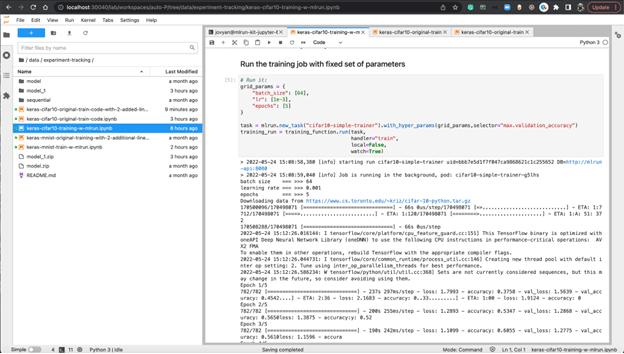
The experiment is tracked in MLRun, and you can view all the related information for the training job by following the link under uid in your notebook output cell.
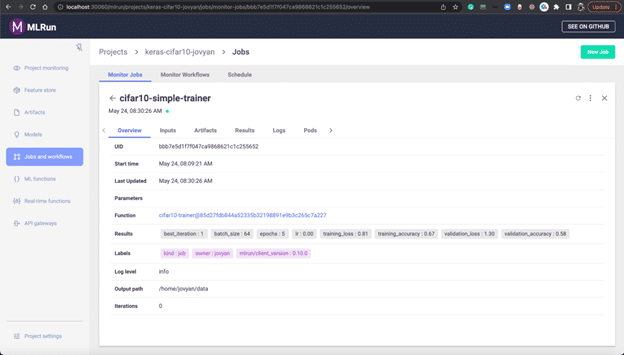
This is the Overview of the job run:
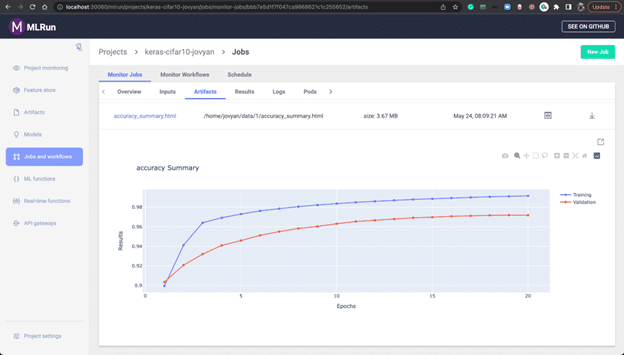
The Artifacts show the training loss, training accuracy, model, accuracy summary, etc:
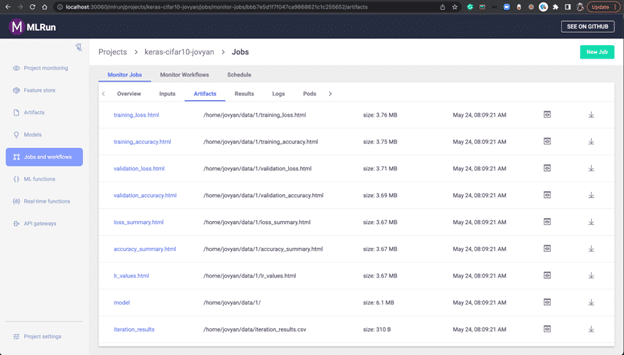
For example, here is an accuracy summary:
Bonus: You Also Get Hyperparameter Tuning in MLRun
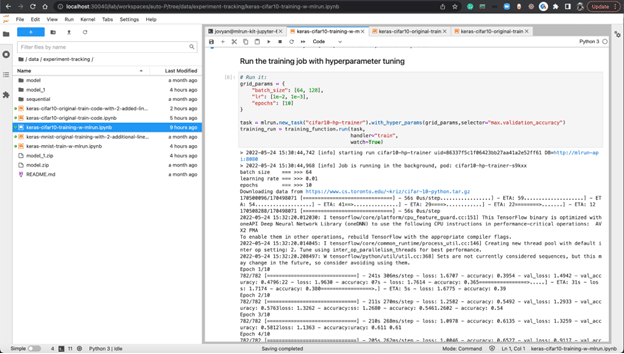
When running the training job in MLRun, you don’t just get experiment tracking, you also get hyperparameter tunning without changing any of your code.
As you can see in the following, to achieve hyperparameter tunning, the only thing you need is to change the params you pass into the MLRun task.
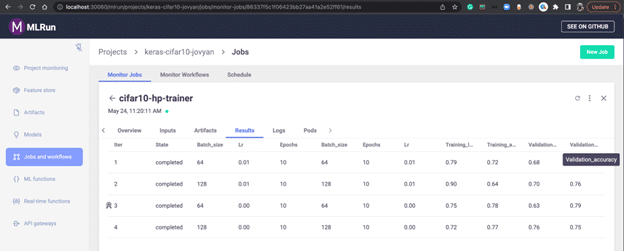
Depending on the hyperparameter selector criteria to use, in this example, we set the selector to the maximum of the validation accuracy. The best hyperparameter combination will be selected for you, here with batch size 64, learning rate 0.001, and epochs 10 results in the highest validation accuracy.
What’s Next?
With MLRun, you can start to track your machine learning experiments with two extra lines of code in your original model training work. However, experiment tracking and hyperparameter tuning are only a small portion of the basic features of an MLOps framework. MLRun includes many more MLOps features. MLRun is an integral part of the Iguazio platform. Iguazio is an enterprise-ready automated MLOps platform that provides features such as feature store, real-time model serving pipeline, model monitoring & re-training, CI/CD for ML, and more.
To get started with MLRun, check out the Quickstart.
To get a free version of the enterprise version, check out the free trial.

