Data Monitoring and Visualization Services and Tools
Overview
There are various tools that allow you to monitor and query your data and produce graphical interactive representations that make it easy to quickly analyze the data and begin discovering new actionable insights in a matter of seconds, with no programming effort.
Grafana
The Grafana open-source platform for data analytics, monitoring, and visualization is pre-integrated in the platform and available as a user application service.
In addition, there's a predefined single-instance tenant-wide Grafana service for IT administrators, which has dashboards with monitoring data at the application-cluster level.
All Grafana services in the platform have predefined dashboards that leverage the platform's monitoring service to display monitoring data, such as performance statistics, for application services. For more information, see Monitoring Platform Services.
You can use the Grafana service to define custom Grafana dashboards for monitoring, visualizing, and understanding data stored in the platform.
This can be done by using the custom iguazio data source.
You can also issue data alerts and create, explore, and share dashboards.
For more information, see Adding Grafana Dashboards.
Grafana supports Node affinity.
See also the Grafana restrictions in the Software Specifications and Restrictions documentation.
Remote Visualization Tools
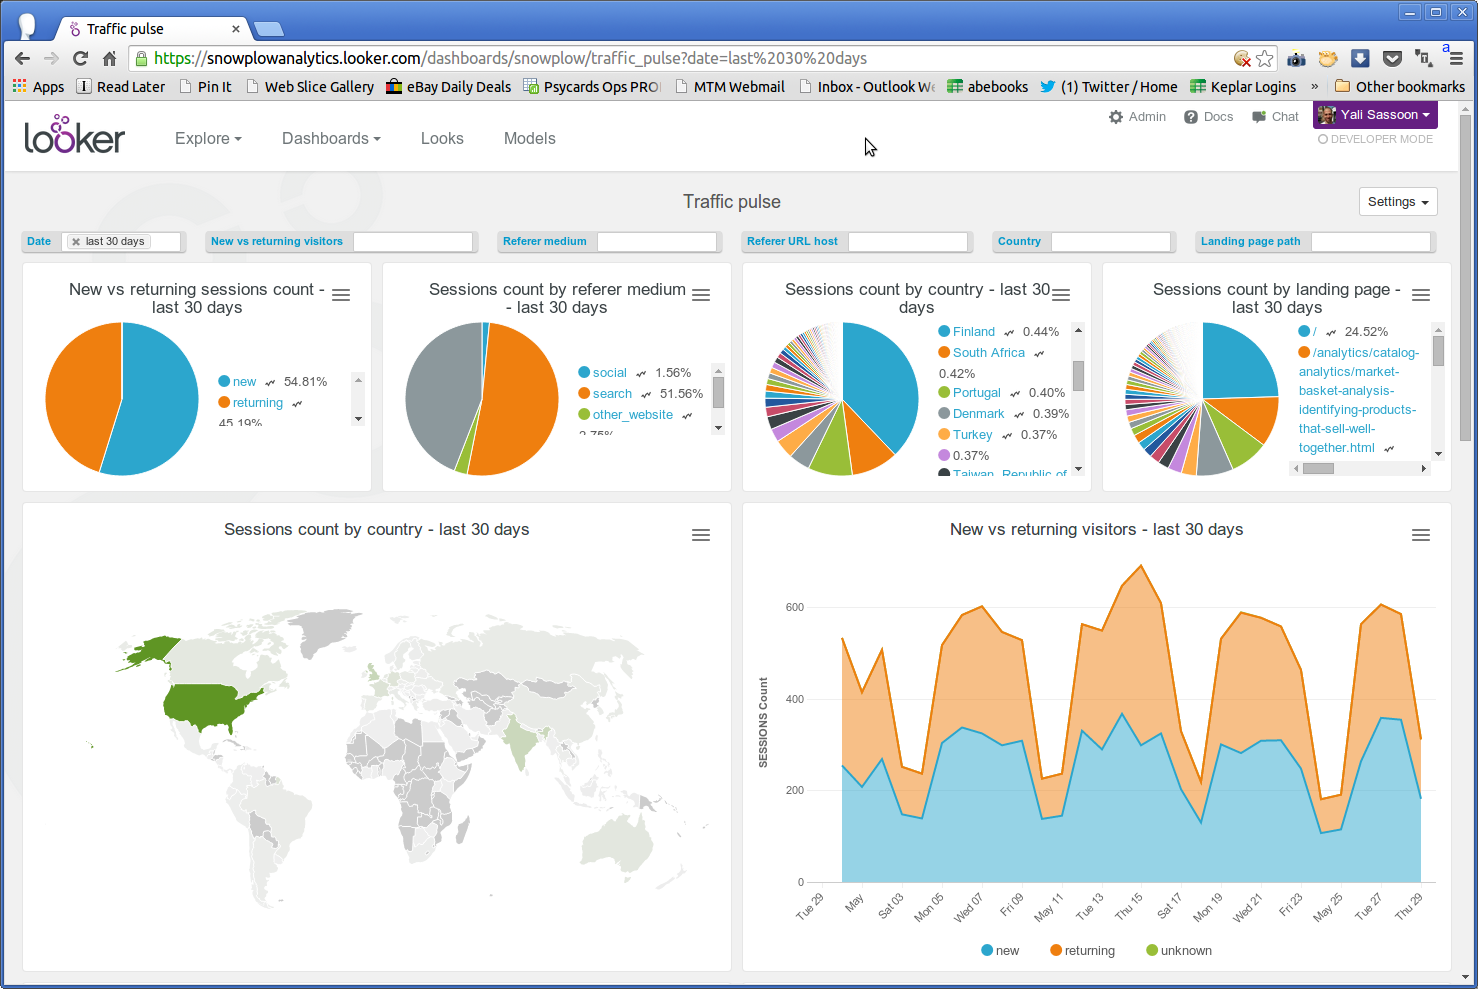
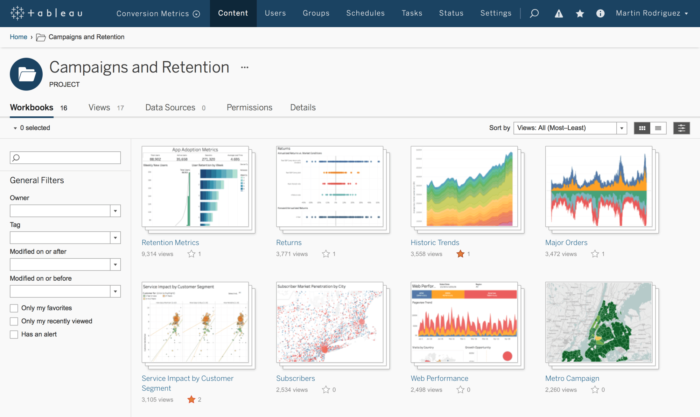
All leading BI data visualization tools can be installed remotely and configured to run on top of the data services of the Iguazio AI Platform over a Java database connectivity (JBDC) connector. The following images display data visualization using the popular Tableau, QlikView, and Looker visualization tools:
Tableau
QlikView

Looker